Hip displasia, early detection of hip joint laxity
Hip dysplasia is a common developmental condition characterised by subluxation and incongruency between the acetabular and femoral joint surfaces. Medium to giant breeds of dogs are more often affected, but hip dysplasia can occur in small breed dogs and also in cats.
Early diagnosis is important for identifying affected dogs and planning treatment. A thorough clinical examination is the first step in suspect patients and should be performed prior to any radiographic examination. Once an index of suspicion is established, radiography with standard ventrodorsal views (with caudally extended femurs) can be diagnostic, and it provides some information about joint laxity and degenerative changes. Coxofemoral laxity is considered the most important factor promoting hip dysplasia, however standard radiography is not always reliable in assessing joint laxity. This is because standard positioning causes overextension of the hip joint, non-physiological tensioning of the pelvic muscles, and spiral tensioning of the non-elastic joint capsule, which results in repositioning of the subluxated femoral head back into the acetabulum.
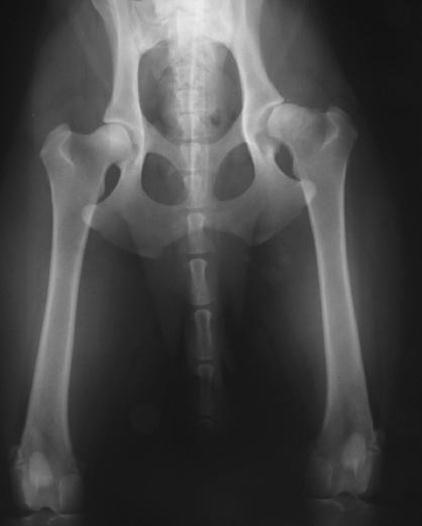
Therefore other views with radiographic stress techniques may be required, as these attempt to quantify maximal dislocation of the femoral head from the acetabulum (see figure 1). In this way a distraction index, a subluxation index, and a dorsolateral subluxation score can be calculated. Radiographic examination for these measurements can be performed from eight months of age, and several studies have suggested that they remain constant after this age.
Two views of a 2.5-year-old male Border collie. left – standard extended radiograph right – stress radiograph allowing measurement of Subluxation Index (note laterodorsal laxity of the right hip, which appeared to be in a normal position in the standard view).
Distraction index (PennHip technique, DI)
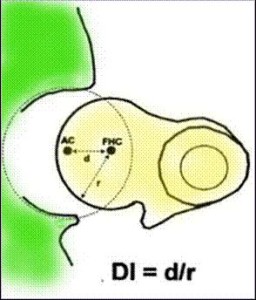
For this measurement the dog is positioned in dorsal recumbency. The hindlimbs are positioned at an 80° angle to the table top avoiding joint capsule tensioning, and a specially designed distracter is used to achieve lateral displacement of the hips. Figure 2 shows that the distraction index (DI) is defined as the ratio of the distance (d) from the centre of the femoral head to the centre of the acetabulum, and the radius (r) of the femoral head (DI=d/r). It has been shown that dogs with a DI
Subluxation index (SI)
Again the dog is positioned in dorsal recumbency. The femurs are held in a physiological position at 60° to the table top, and manual pressure is applied to the tibia to push the femurs craniodorsally. The forces applied to the femoral heads replicate force vectors present during locomotion. The subluxation index (SI) is calculated in a similar way as the DI, and 95% of dogs with a SI>0.5 are dysplastic. In a study, all dogs with grade D or E dysplasia (presence of osteoarthrosis) showed an SI>0.3, and of the dogs with normal or borderline hips (grade A or B) only 71% had an SI<0.3, 28% had an SI between 0.3 and 0.5, and 1% had an SI>0.5. It was concluded that a substantial number of dogs may not develop coxarthrosis despite the presence of obvious femoral laxity. It is a common clinical finding to have dogs with hip joints free of OA that subluxate under stress, for example when the Ortolani sign is assessed.
Dorsolateral subluxation score (DLS)
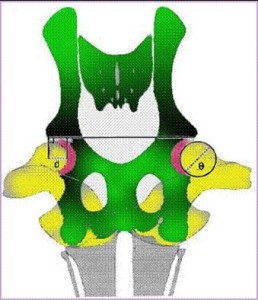
For this technique the dog is positioned in sternal recumbency with the femurs perpendicular to and in contact with the table to mimic a weight-bearing position. The dog is maintained in this position with foam pads, and this technique can also be applied for CT imaging. The aim of this measurement technique is to evaluate craniodorsal laxity of the joint rather than just lateral laxity. To measure the DLS score, a straight line is drawn joining the cranial acetabular lateral margin of each hip (figure 3). A perpendicular line is then dropped from this line at the most medial edge of the femoral head, and also from the lateral margin of the cranial acetabulum. The distance between these two perpendicular lines (d) is measured in mm, and the DLS score is determined by dividing d by the widest diameter of the femoral head (θ) from the same hip – DLS(%)=(d/θ) x 100. This score represents the percentage of the femoral head that is medial to the cranial acetabular rim, which indicates the coverage of the femoral head by the acetabulum. In one study, joints classified as not susceptible to develop OA had a mean score of 64% ± 1.5%, while hip joints having a high probability of developing OA had a score of 39% ± 2.6%.
The DI, SI, and DLS are the primary methods used to establish the likelihood of hip disease in individual patients, prior to the more obvious signs of osteoarthritis. In susceptible individuals, early detection may increase the chances of successful treatment or management.


